Good whatever time it happens to be for you dear reader. Today's post
is in regard to the my first weeks assignment in my Cartography skills
class. The overview of the assignment is this: learn the basic
principles behind what makes an effect map and apply them to some maps
of your choosing. Let me break down the key components that I reviewed.
Numerically there are 6 commandments to a map, and 20 Tufteisims (the
guy who so aptly put words to successful design elements of map), and 5
key British Cartographic Society inputs. For a better look at these as
outlined by my Cartographic professors products, please see below (after
the Good/Bad comparison).
So, being deployed while starting this class I find it only appropriate
to include a map of where I happen to be staying. Usually, for those
who have never been here, there is a lot of mystery behind this place
and its people. And the general populace of this class may or may not
know how diverse the makeup of this country really is. The below map is
an excellent portrayal of the diversity of Afghanistan.

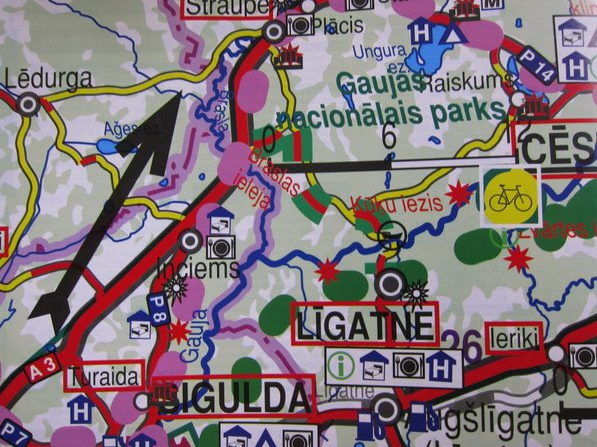
The above is an example of a well-designed map. I have come to this conclusion based on the following observations. First, even without a prominent title you still see the substantial information that the creator is intending to portray; Ethnolinguistic groups in Afghanistan. This is noticed as Afghanistan is prominently displayed with other details of surrounding countries fading away from the center. The color scheme highlights the complexity of how the varying groups are dispersed while not being overshadowed by the labeling scheme of the sub-data, such as the major cities in Afghanistan. The map has an efficient layout, accenting the countries natural contours, evidenced by the legend being effectively placed in the bottom right of the picture. Further “Chart Junk” is minimized to key components such as the distance scale, also aptly placed below the legend. Lastly the information is straight forward showing where majority groups are, there is little left to interpret about the data. There is no room to lie with this map, assuming the data used in its compilation was accurate.
The above is an example of a well-designed map. I have come to this
conclusion based on the following observations. First, even without a
prominent title you still see the substantial information that the
creator is intending to portray; Ethnolinguistic groups in Afghanistan.
This is noticed as Afghanistan is prominently displayed with other
details of surrounding countries fading away from the center. The color
scheme highlights the complexity of how the varying groups are dispersed
while not being overshadowed by the labeling scheme of the sub-data,
such as the major cities in Afghanistan. The map has an efficient
layout, accenting the countries natural contours, evidenced by the
legend being effectively placed in the bottom right of the picture.
Further “Chart Junk” is minimized to key components such as the distance
scale, also aptly placed below the legend. Lastly the information is
straight forward showing where majority groups are, there is little left
to interpret about the data. There is no room to lie with this map,
assuming the data used in its compilation was accurate.

Thank you for taking the time to go over
this with me, I appreciate it. And once
again, per the first paragraph, if youre
curious about the rules of maps then
please see the document to the right.
Thank you, come again.
v/r
Brandon
Thank you, come again.
v/r
Brandon
No comments:
Post a Comment